Daily Usage
Daily usage shows token usage and estimated costs aggregated by calendar date. By default, ccusage daily combines every detected supported data source; use ccusage <source> daily when you want one source.
Basic Usage
Show all daily usage:
ccusage daily
# or simply:
ccusage

# Focus on one source:
ccusage codex daily
ccusage opencode daily
ccusage amp daily
ccusage pi daily
The daily command is the default, so you can omit it when running ccusage.
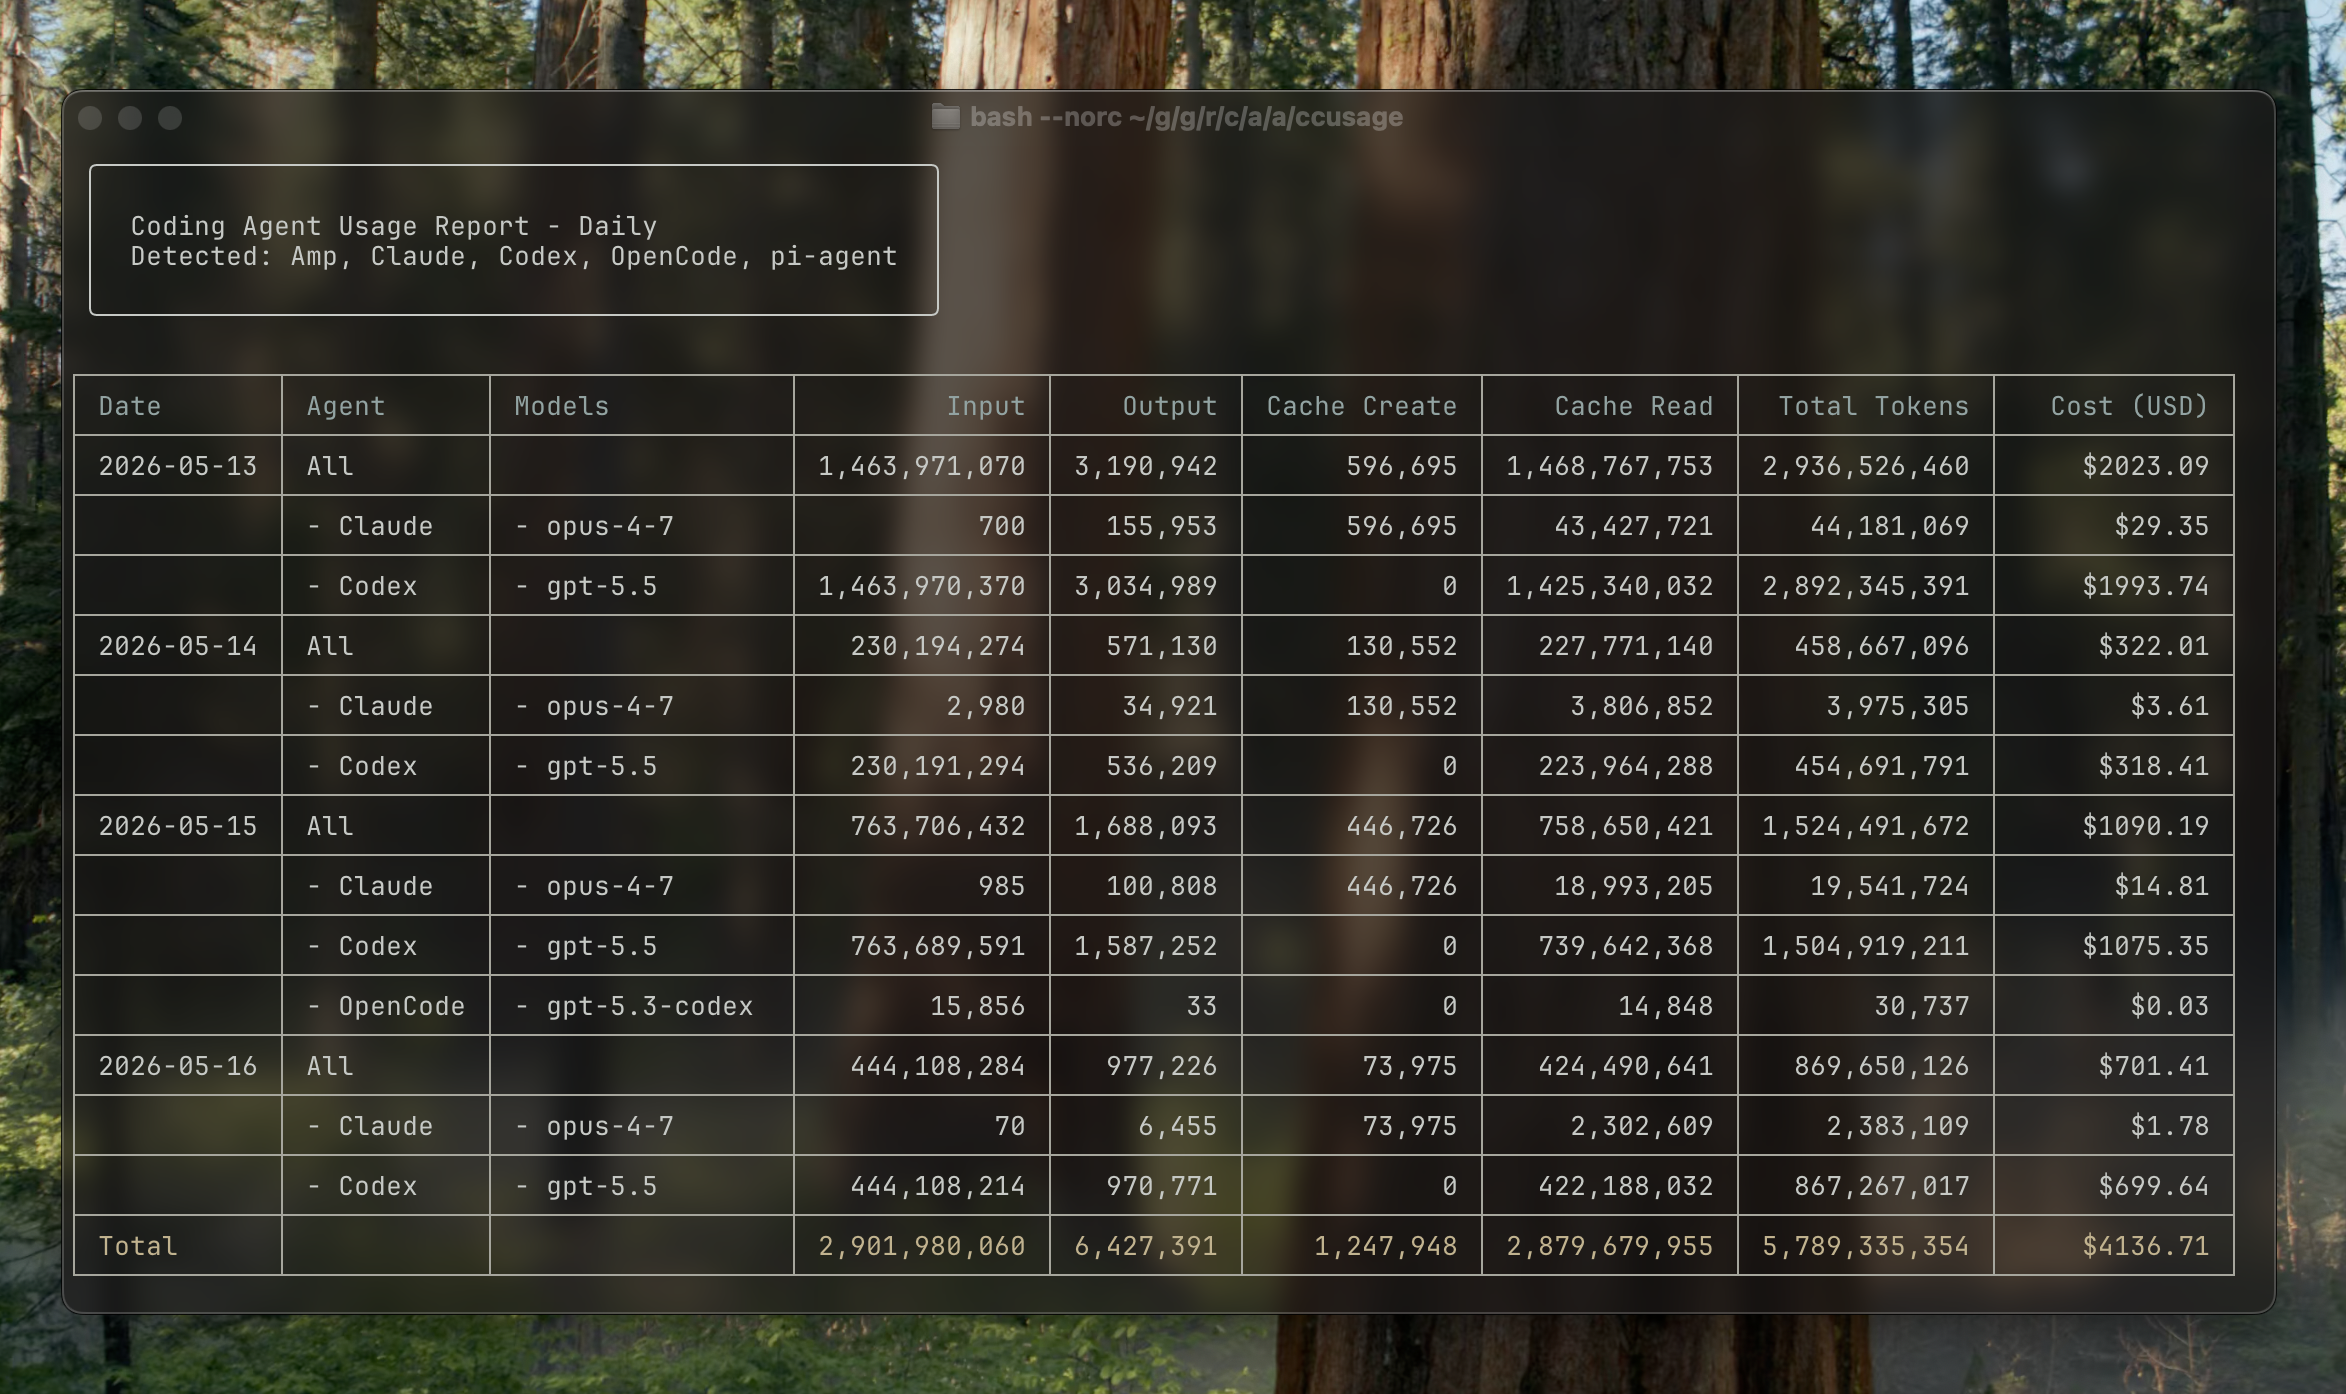
Example Output
Understanding the Columns
Basic Columns
- Date: Calendar date in YYYY-MM-DD format
- Agent: Source CLI for unified reports
- Models: Models used that day (shown as a bulleted list)
- Input: Total input tokens sent to the model
- Output: Total output tokens received from the model
- Cost (USD): Estimated cost for that day
Cache Columns
- Cache Create: Tokens used to create cache entries
- Cache Read: Tokens read from cache (typically cheaper)
Responsive Display
ccusage automatically adapts to your terminal width:
- Wide terminals (≥100 chars): Shows all columns
- Narrow terminals (<100 chars): Compact mode with essential columns only
Command Options
Date Filtering
Filter reports by date range:
# Show usage from May 2026
ccusage daily --since 20260501 --until 20260516

# Show last week
ccusage daily --since 20260510 --until 20260516

# Show usage since a specific date
ccusage daily --since 20260501
Sort Order
Control the order of dates:
# Newest dates first (default)
ccusage daily --order desc

# Oldest dates first
ccusage daily --order asc
Cost Calculation Modes
Control how costs are calculated:
# Use pre-calculated costs when available (default)
ccusage daily --mode auto

# Always calculate costs from tokens
ccusage daily --mode calculate

# Only show pre-calculated costs
ccusage daily --mode display
Model Breakdown
See per-model cost breakdown:
ccusage daily --breakdownThis shows costs split by individual models:
┌──────────────┬──────────────────┬────────┬─────────┬────────────┐
│ Date         │ Models           │ Input  │ Output  │ Cost (USD) │
├──────────────┼──────────────────┼────────┼─────────┼────────────┤
│ 2026-05-16   │ opus-4-1, sonnet-4-5 │    277 │  31,456 │     $17.58 │
├──────────────┼──────────────────┼────────┼─────────┼────────────┤
│   └─ opus-4-1  │                  │    100 │  15,000 │     $10.25 │
├──────────────┼──────────────────┼────────┼─────────┼────────────┤
│   └─ sonnet-4-5│                  │    177 │  16,456 │      $7.33 │
└──────────────┴──────────────────┴────────┴─────────┴────────────┘
JSON Output
Export data as JSON for further analysis:
ccusage daily --json{
"type": "daily",
"data": [
{
"date": "2026-05-16",
"models": ["claude-opus-4-1-20250805", "claude-sonnet-4-5-20250929"],
"inputTokens": 277,
"outputTokens": 31456,
"cacheCreationTokens": 512,
"cacheReadTokens": 1024,
"totalTokens": 33269,
"costUSD": 17.58
}
],
"summary": {
"totalInputTokens": 277,
"totalOutputTokens": 31456,
"totalCacheCreationTokens": 512,
"totalCacheReadTokens": 1024,
"totalTokens": 33269,
"totalCostUSD": 17.58
}
}Offline Mode
Use cached pricing data without network access:
ccusage daily --offline
# or short form:
ccusage daily -O
Project Analysis
Group usage by project instead of aggregating across all projects:
# Group daily usage by project
ccusage daily --instances
ccusage daily -i
When using --instances, the report shows usage for each project separately:
┌──────────────┬────────────────────────────────────────────────────────────────────────────────────────────┐
│ Project: my-project                                                                                     │
├──────────────┬──────────────────┬────────┬─────────┬────────────┬────────────┬─────────────┬──────────┤
│ Date         │ Models           │ Input  │ Output  │ Cache Create│ Cache Read │ Total Tokens│ Cost (USD)│
├──────────────┼──────────────────┼────────┼─────────┼────────────┼────────────┼─────────────┼──────────┤
│ 2026-05-16   │ • sonnet-4-5       │    277 │  31,456 │         512│      1,024 │      33,269 │     $7.33│
└──────────────┴──────────────────┴────────┴─────────┴────────────┴────────────┴─────────────┴──────────┘

┌──────────────┬────────────────────────────────────────────────────────────────────────────────────────────┐
│ Project: other-project                                                                                  │
├──────────────┬──────────────────┬────────┬─────────┬────────────┬────────────┬─────────────┬──────────┤
│ Date         │ Models           │ Input  │ Output  │ Cache Create│ Cache Read │ Total Tokens│ Cost (USD)│
├──────────────┼──────────────────┼────────┼─────────┼────────────┼────────────┼─────────────┼──────────┤
│ 2026-05-16   │ • opus-4-1         │    100 │  15,000 │         256│        512 │      15,868 │    $10.25│
└──────────────┴──────────────────┴────────┴─────────┴────────────┴────────────┴─────────────┴──────────┘
Filter to a specific project:
# Show only usage from "my-project"
ccusage daily --project my-project
ccusage daily -p my-project

# Combine with instances flag
ccusage daily --instances --project my-project
Common Use Cases
Track Monthly Spending
# See May 2026 usage
ccusage daily --since 20260501 --until 20260516
Find Expensive Days
# Sort by cost (highest first)
ccusage daily --order desc
Export for Spreadsheet Analysis
ccusage daily --json > may-usage.jsonCompare Model Usage
# See which models you use most
ccusage daily --breakdown
Check Recent Activity
# Last 7 days
ccusage daily --since $(date -d '7 days ago' +%Y%m%d)
Analyze Project Usage
# See usage breakdown by project
ccusage daily --instances

# Track specific project costs
ccusage daily --project my-important-project --since 20260501

# Compare project usage with JSON export
ccusage daily --instances --json > project-analysis.json
Team Usage Analysis
Use project aliases to replace cryptic or long project directory names with readable labels:
// .ccusage/ccusage.json - Set custom project names for better reporting
{
	"commands": {
		"daily": {
			"projectAliases": "uuid-project=Frontend App,long-name=Backend API"
		}
	}
}
The projectAliases setting uses a comma-separated format of original-name=display-name pairs. This is especially useful when:
- Your projects have UUID-based names (e.g.,
a2cd99ed-a586=My App) - Directory names are long paths that get truncated
- You want consistent naming across team reports
# Generate team report with readable project names
ccusage daily --instances --since 20260501
# Now shows "Frontend App" instead of "uuid-project"
Tips
- Compact Mode: If your terminal is narrow, expand it to see all columns
- Date Format: Use YYYYMMDD format for date filters (e.g., 20260516)
- Regular Monitoring: Run daily reports regularly to track usage patterns
- JSON Export: Use
--jsonfor creating charts or additional analysis
Related Commands
- All Sources (Default) - How unified views work
- Monthly Usage - Aggregate by month
- Session Usage - Per-conversation analysis
- Claude Code - Claude Code-specific setup and features